
Here are some tips on setting up your Rust debugger workflow.
So far I’ve used the debugger in the VS Code and CLion (built on top of Intellij) editors. The debugger tooling in Rust is still in the early days, but it is improving very quickly. As of today both editors that I mentioned already have some good UI that will help you debug your project.
VS Code
The examples below use a modified Rocket (A Rust web framework) example to showcase the debugger in action. If you want to get this particular example working do the following:
git clone https://github.com/SergioBenitez/Rocket.git
cd Rocket/examples/hello_world
code .
This should get VS Code open for you inside the Rocket hello_world example. Now let’s get the `CodeLLDB` extension:
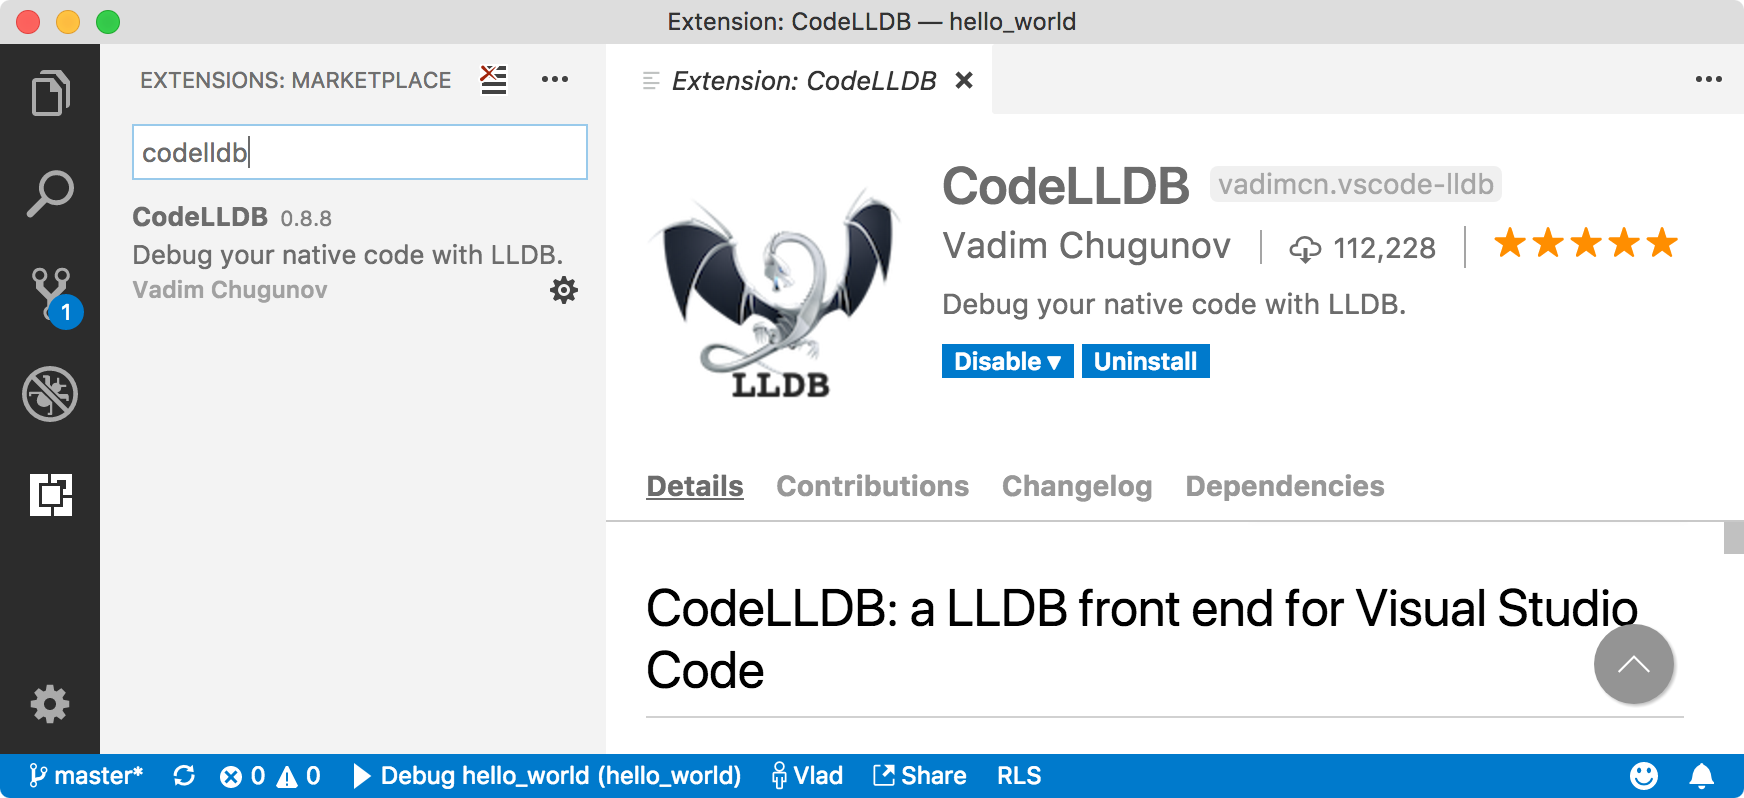
Install the extension and reload VS Code. To make the debugging example a bit better, modify the fn hello() function to provide an output variable instead of returning "Hello World" right away (see screenshot below). Now you can set some breakpoints. A great demo for this is to set a breakpoint in main() and in the route handler fn hello().
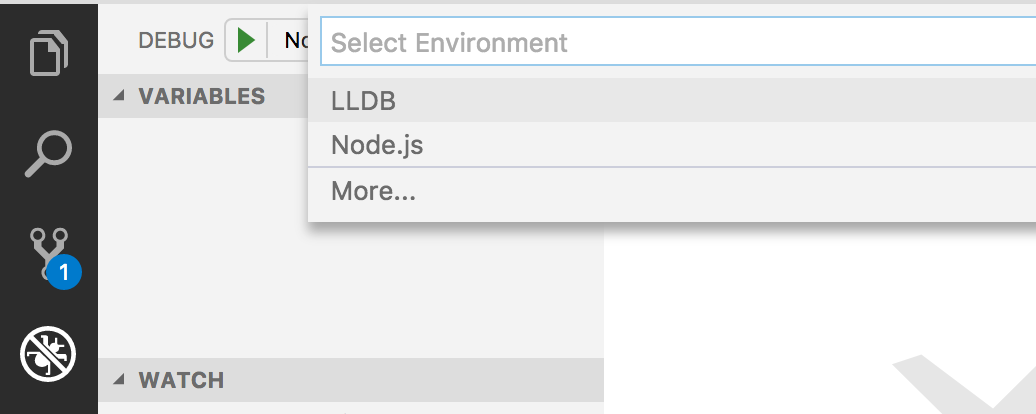
Go to the Debug panel in VS Code and find “Add configuration” in the top left Debug panel. Select LLDB in configuration option:
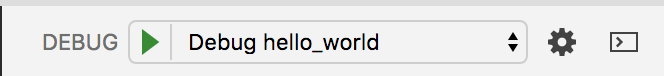
The extension will automatically find all available Rocket runnable binaries, there are a lot of them listed, but you need to find Debug hello_world and press >:
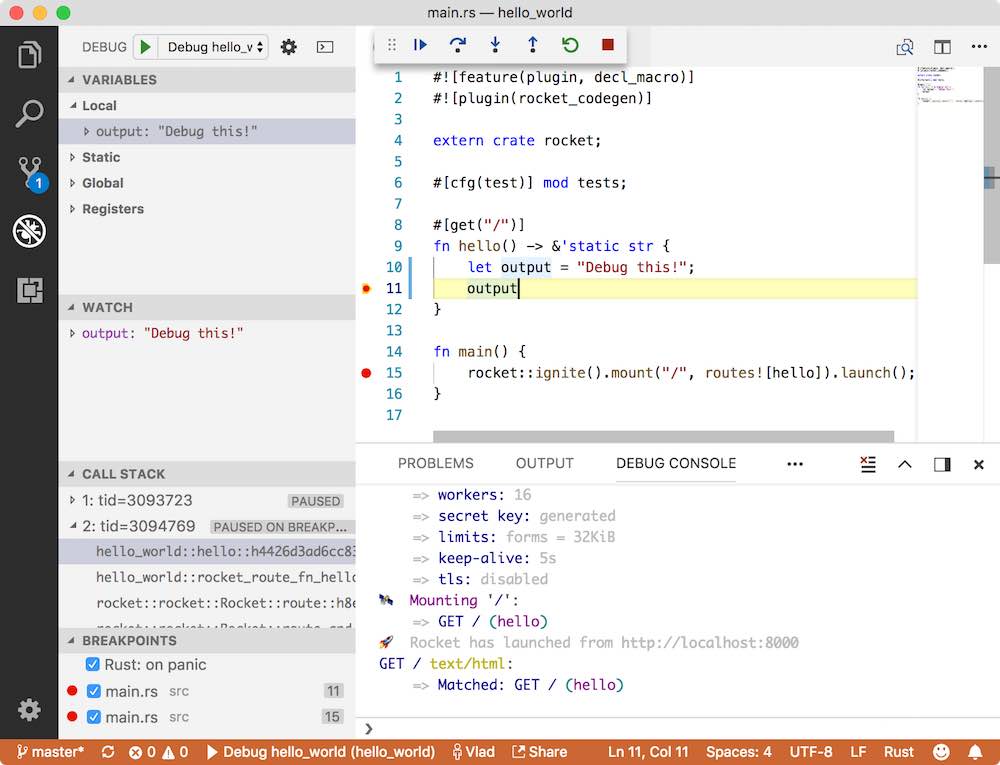
Now the Rocket server will start and stop at your first breakpoint. Play through the first breakpoint and use your browser to open http://localhost:8000. The second breakpoint will now hit and will be able to see the output variable on the left side, you can also add the output to “Watched” variables.
VS Code provides a free Rust debugging option thanks to the hard work of the github.com/vadimcn/vscode-lldb project.
CLion
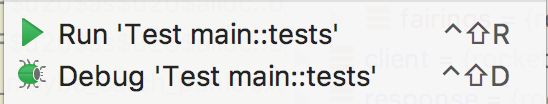
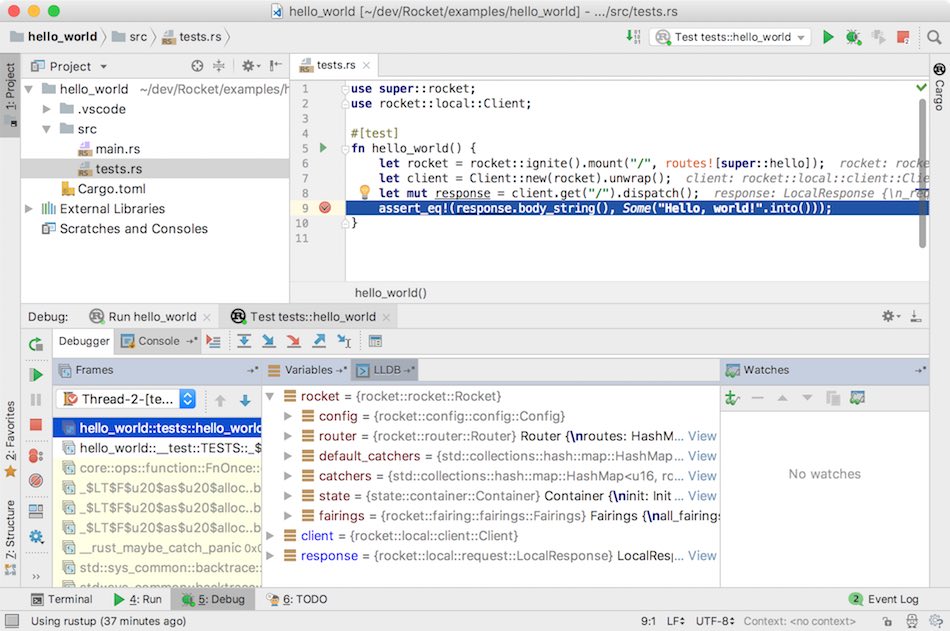
A paid alternative is available through CLion. If you open the same example in CLion you can try a more complex example and debug the tests tests.rs file. Find the file, set a breakpoint on assert_eq! in the test, open the context menu on the file and run “Debug ‘Test main::tests'”:
This will automatically create a runnable configuration in the IDE. You should now see the debugger in the bottom of the IDE with inspectable variables under “Variables”:
This should be enough to get started debugging your Rust project. There are still debugger bugs and missing functionality in both of the editors, but these tools should already be able to make your Rust development life simpler.